Back
11 Mar 2019
Gold Technical Analysis: Corrective bounce may be over
Gold's corrective bounce from the lows near $1,280 seen yesterday seems to have run its course and prices could revisit $1,290, the hourly and 4-hour charts indicate. As of writing, the yellow metal is trading at $1,297, having hit a high of $1,300.80 on Friday.
Hourly chart
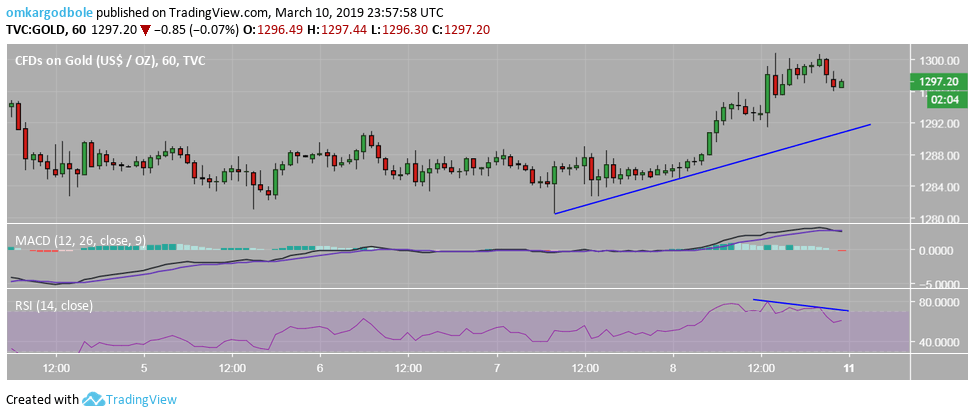
The bearish divergence of the relative strength index (RSI) and the bearish crossover on the moving average convergence divergence (MACD) indicate prices could fall back to the ascending trendline support, currently at $1,290.
4-hour chart
-636878591910830665.png)
Multiple doji candles on the above chart represent indecision in the market place and could invite strong selling pressure.
Trend: Bearish