AUD/JPY Technical Analysis: Eyes on three-week-old rising trendline after Japan GDP
- AUD/JPY declines after Japan’s upbeat GDP/trade data.
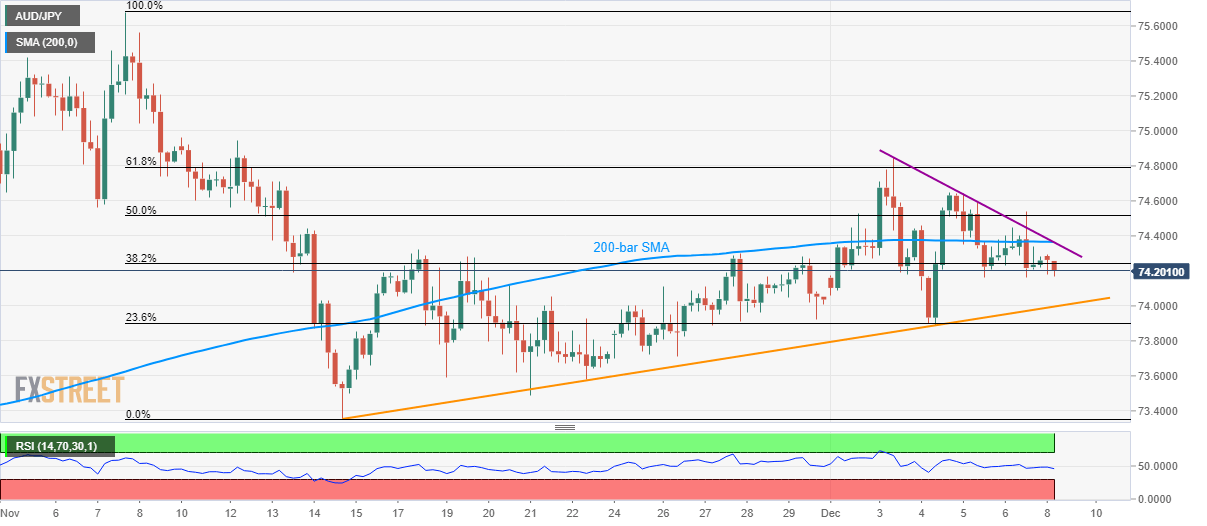
- An upward sloping support line since mid-November gains sellers’ attention.
- 200-bar SMA, one-week-old falling trend line restrict immediate upside.
AUD/JPY trades around 74.20, after flashing a low of 74.17, on early Monday. The quote reacted to Japan’s upbeat Gross Domestic Product (GDP) and Trade Balance data.
Japan’s third-quarter (Q3) GDP (QoQ) rose beyond 0.2% expectations and 0.1% preliminary forecast to +0.4% while the yearly figure stood unchanged at 0.6%. Further, Japan’s October month Trade Balance on the Balance of Payments (BOP) basis crossed ¥1.1 B prior with a whooping ¥254 B.
Read: Japanese GDP Q3 beats expectations by 0.2%
The pair now seems to decline towards near-term rising support line, at 74.00. However, 23.6% Fibonacci retracement of November month fall, near 73.90, can stop the further downpour.
Should there be additional weakness past-73.90, the previous month’s low near 73.35 will be on the Bears’ radar.
Meanwhile, 200-bar Simple Moving Average (SMA) and an immediate falling trend line limit the pair’s near-term upside around 74.35/40.
In a case prices rally beyond 74.40, 61.8% Fibonacci retracement close to 74.80 and November 10 high around 75.00 could return to the charts.
AUD/JPY four-hour chart
Trend: Bearish