Back
10 Jan 2020
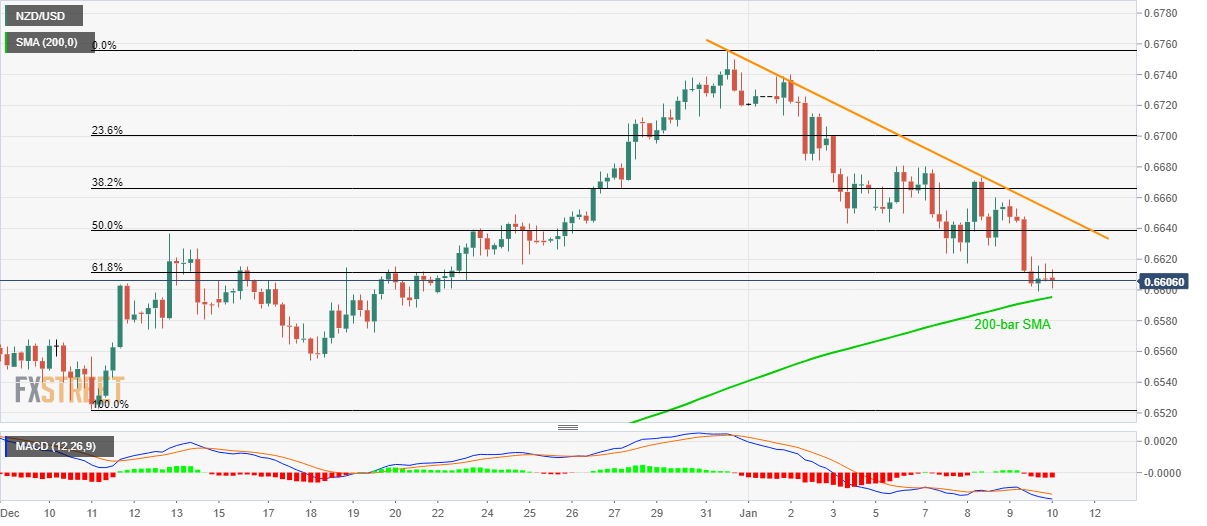
NZD/USD Technical Analysis: Break of 61.8% Fibonacci, bearish MACD signal further declines
- NZD/USD seesaws around 14-day low after breaking 61.8% Fibonacci retracement.
- 200-bar SMA limits immediate declines, December 18 bottom on seller’s radar.
- A descending trend line since December 31 adds to the resistance.
NZD/USD declines to 0.6600, following its sustained trading below 61.8% Fibonacci retracement of December month rise, during early Friday.
While bearish MACD signal further declines by the pair, a 200-bar SMA level of 0.6595 acts as the nearest support holding the keys to December 18 low surrounding 0.6554.
If NZD/USD prices keep trading south after 0.6554, the December month low near 0.6520 and 0.6500 round-figure could return to the chart.
On the flip side, short-term falling trend line resistance, at 0.6652 now, can keep the pair under pressure, a break of which will recall 0.6700 mark for buyers.
However, December top near 0.6755 and July 2019 high around 0.6792 will question the Bulls afterward.
NZD/USD daily chart

Trend: Bearish
