Back
14 May 2020
S&P 500 Asia Price Forecast: US stocks rebound into the New York close
- S&P 500 bullish recovery from mid-March stays intact.
- The level to beat for buyers is the 2900 resistance.
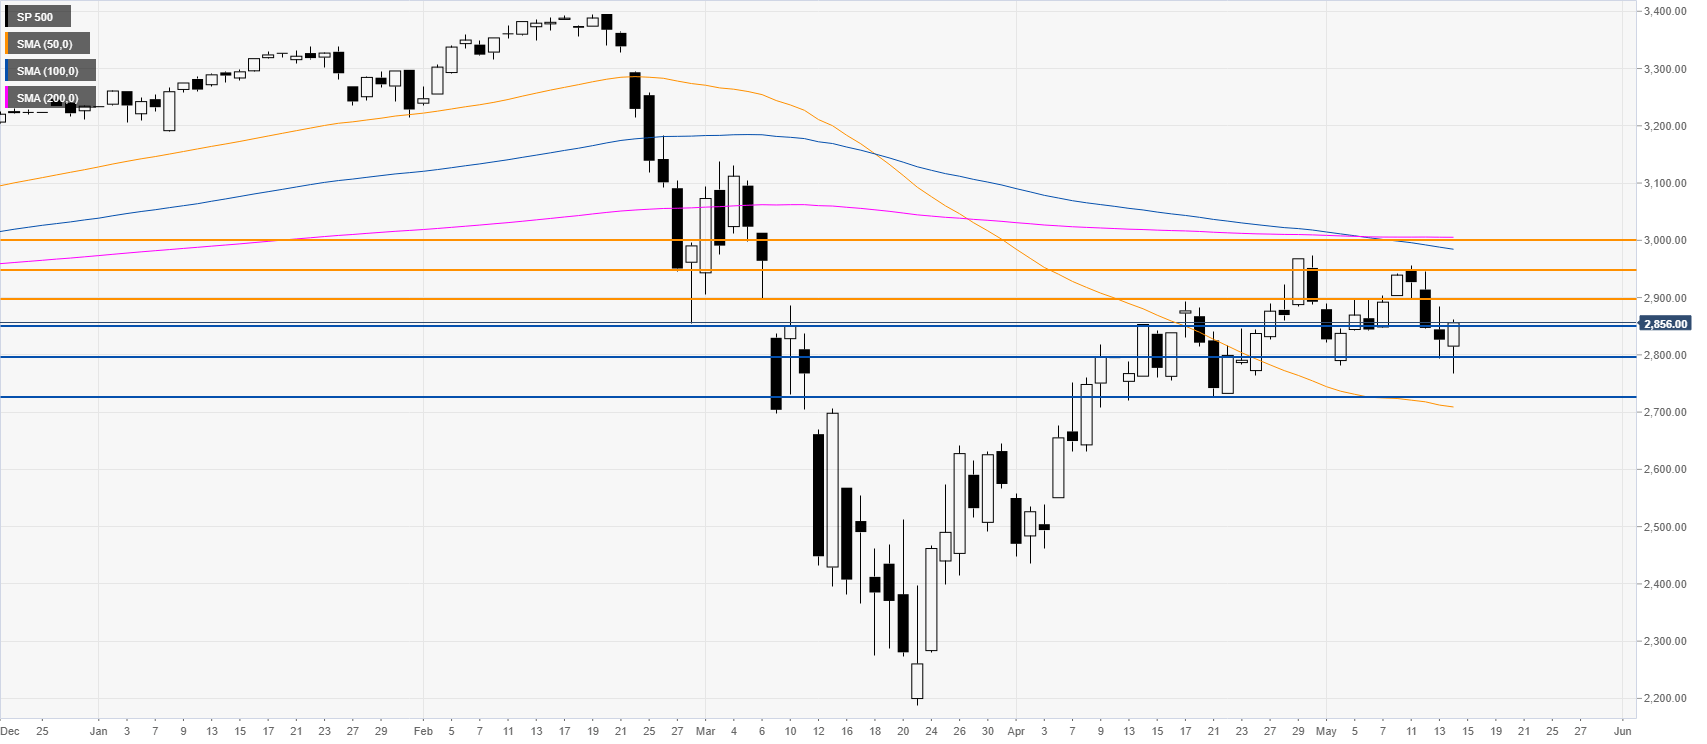
S&P 500 daily chart
After the February-March sharp down move, the S&P 500 has been recovering nicely. The market is consolidating the advance while bouncing from the 2800 level trading above the 50 SMA on the daily chart. Buyers remain in full control of the S&P 500 with bulls looking to regain the 2900 resistance en route towards the 2950 level and the 3000 round figure near the 100 and 200 SMAs. Conversely, support I seen near 2855 and 2800 levels.
Additional key levels