S&P 500 Price Analysis: Battle lines well-defined after the stimulus-inspired rally – Confluence Detector
The S&P 500 Index has surged after the Federal Reserve announced it will be buying corporate bonds and as the administration is contemplating infrastructure spending. Can it continue higher or will investors take profits? The technical battle lines in both directions are clear.
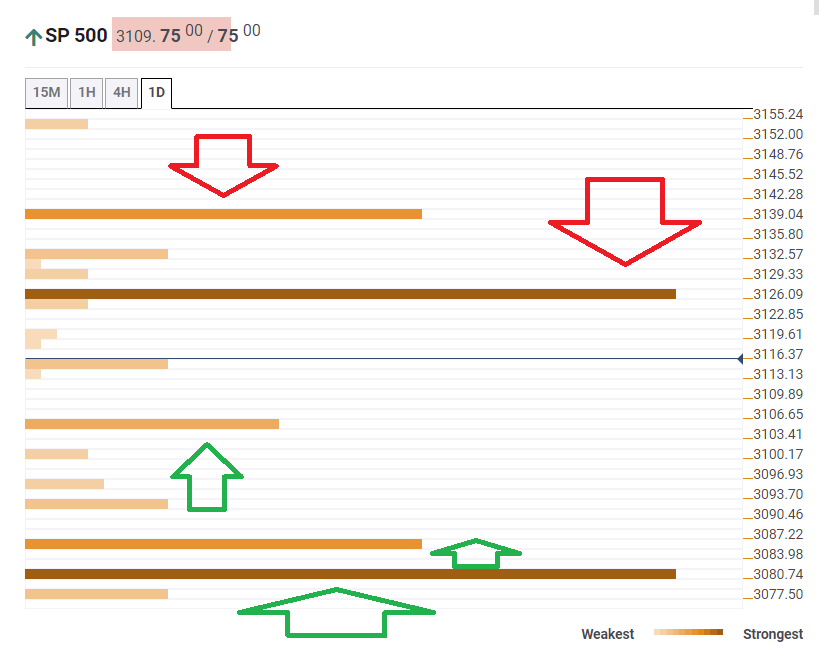
The Technical Confluences Indicator is showing that fierce resistance awaits at 3,126, which is the convergence of the previous 4h-high, the Pivot Point one-day Resistance 1, and the Simple Moving Average 10-one-day.
Further up, the next cap is 3,139, which is where the Fibonacci 61.8% one-week hits the price.
Some support is at 3,105, which is where the SMA 5-one-day awaits the index. Another cushion is at 3,085, where the previous 4h-low hits the price.
Strong support is at 3,080, which is the confluence of the Fibonacci 38.2% one-week and the previous daily high.
Here is how it looks on the tool:
Confluence Detector
The Confluence Detector finds exciting opportunities using Technical Confluences. The TC is a tool to locate and point out those price levels where there is a congestion of indicators, moving averages, Fibonacci levels, Pivot Points, etc. Knowing where these congestion points are located is very useful for the trader, and can be used as a basis for different strategies.
This tool assigns a certain amount of “weight” to each indicator, and this “weight” can influence adjacents price levels. These weightings mean that one price level without any indicator or moving average but under the influence of two “strongly weighted” levels accumulate more resistance than their neighbors. In these cases, the tool signals resistance in apparently empty areas.
Learn more about Technical Confluence