GBP/USD Price Analysis: Bears keep the reins around monthly low under 1.2350
- GBP/USD remains pressured near the early-month bottom inside two-week-old falling trend channel.
- A sustained break below 200-bar SMA, 61.8% Fibonacci retracement keep the sellers hopeful.
- Buyers will wait for the channel’s upside break for fresh entries.
GBP/USD drops to 1.2340 during the early Asian session on Monday. The pair remains depressed inside a falling channel formation since June 08. Recently favoring the bears could be the fall below 200-bar SMA and 61.8% Fibonacci retracement of the quote’s rise from May 18 to June 10.
Other than the downside break of the key technical levels, bearish MACD signals also suggest the pair’s further weakness.
As a result, the channel’s support line around 1.2280 becomes the immediate support for the traders to watch for a bounce, failing to which can recall the 1.2200 mark on the chart.
During the quote’s additional south-run past-1.2200, May 22 low near 1.2160 and the May 17 month bottom surrounding 1.2075 will be in the spotlight.
Meanwhile, 61.8% Fibonacci retracement level of 1.2360 and 200-bar SMA near 1.2410 can keep the pair’s near-term upside chained. Also acting as the important resistance will be 50% Fibonacci retracement, at 1.2445, followed by the said channel’s upper line, at 1.2560 now.
If at all the bulls manage to cross 1.2560, 1.2690 and the monthly top near 1.2815 will be on their radars.
GBP/USD four-hour chart
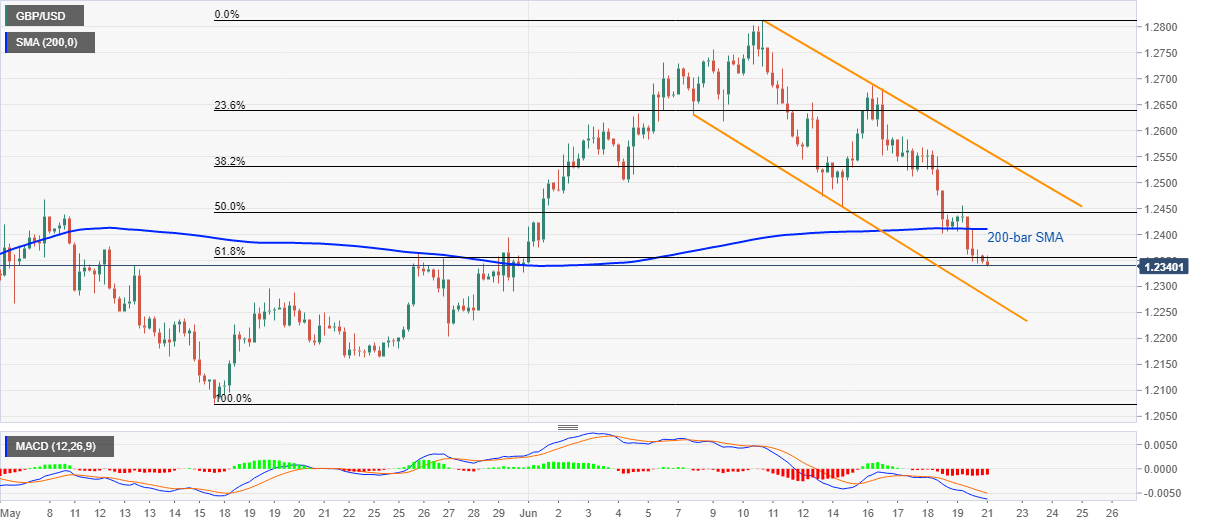
Trend: Bearish