NZD/USD Price Analysis: Mildly bid between 10 and 50-day SMA
- NZD/USD trims Thursday’s losses while keeping short-term trading range.
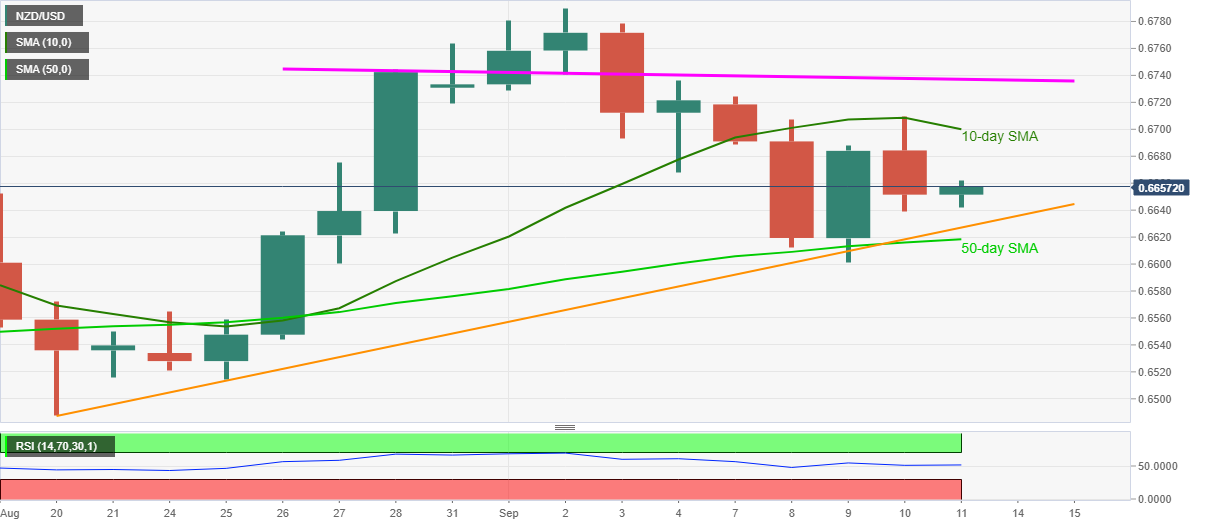
- An ascending trend line August 20 adds to the downside support.
- 0.6740/45 acts as an additional filter to the north ahead of the monthly top.
NZD/USD remains modestly changed, up 0.10% on a day, while taking rounds to 0.6660 during the pre-European trading on Friday. The kiwi pair marked another pullback from 10-day SMA, second in the week, during the previous day.
As a result, the pair’s current moves can be termed as corrective bounce unless breaking the 10-day SMA level of 0.6700.
Even so, the upside momentum needs to cross 0.6740/45 area ahead of challenging the monthly high near 0.6790 while targeting the 0.6800 round-figures.
On the flip side, a three-week-old support line close to 0.6627 precedes a 50-day SMA level of 0.6618 to restrict the quote’s near-term declines.
In a case where the bears enter below 0.6618, backed by the absence of oversold RSI, the monthly low of 0.6600 will be refreshed by putting 0.6570 on the radar.
NZD/USD daily chart
Trend: Sideways