Back
26 Jan 2021
NZD/USD Price Analysis: Consolidates in a narrowing price range
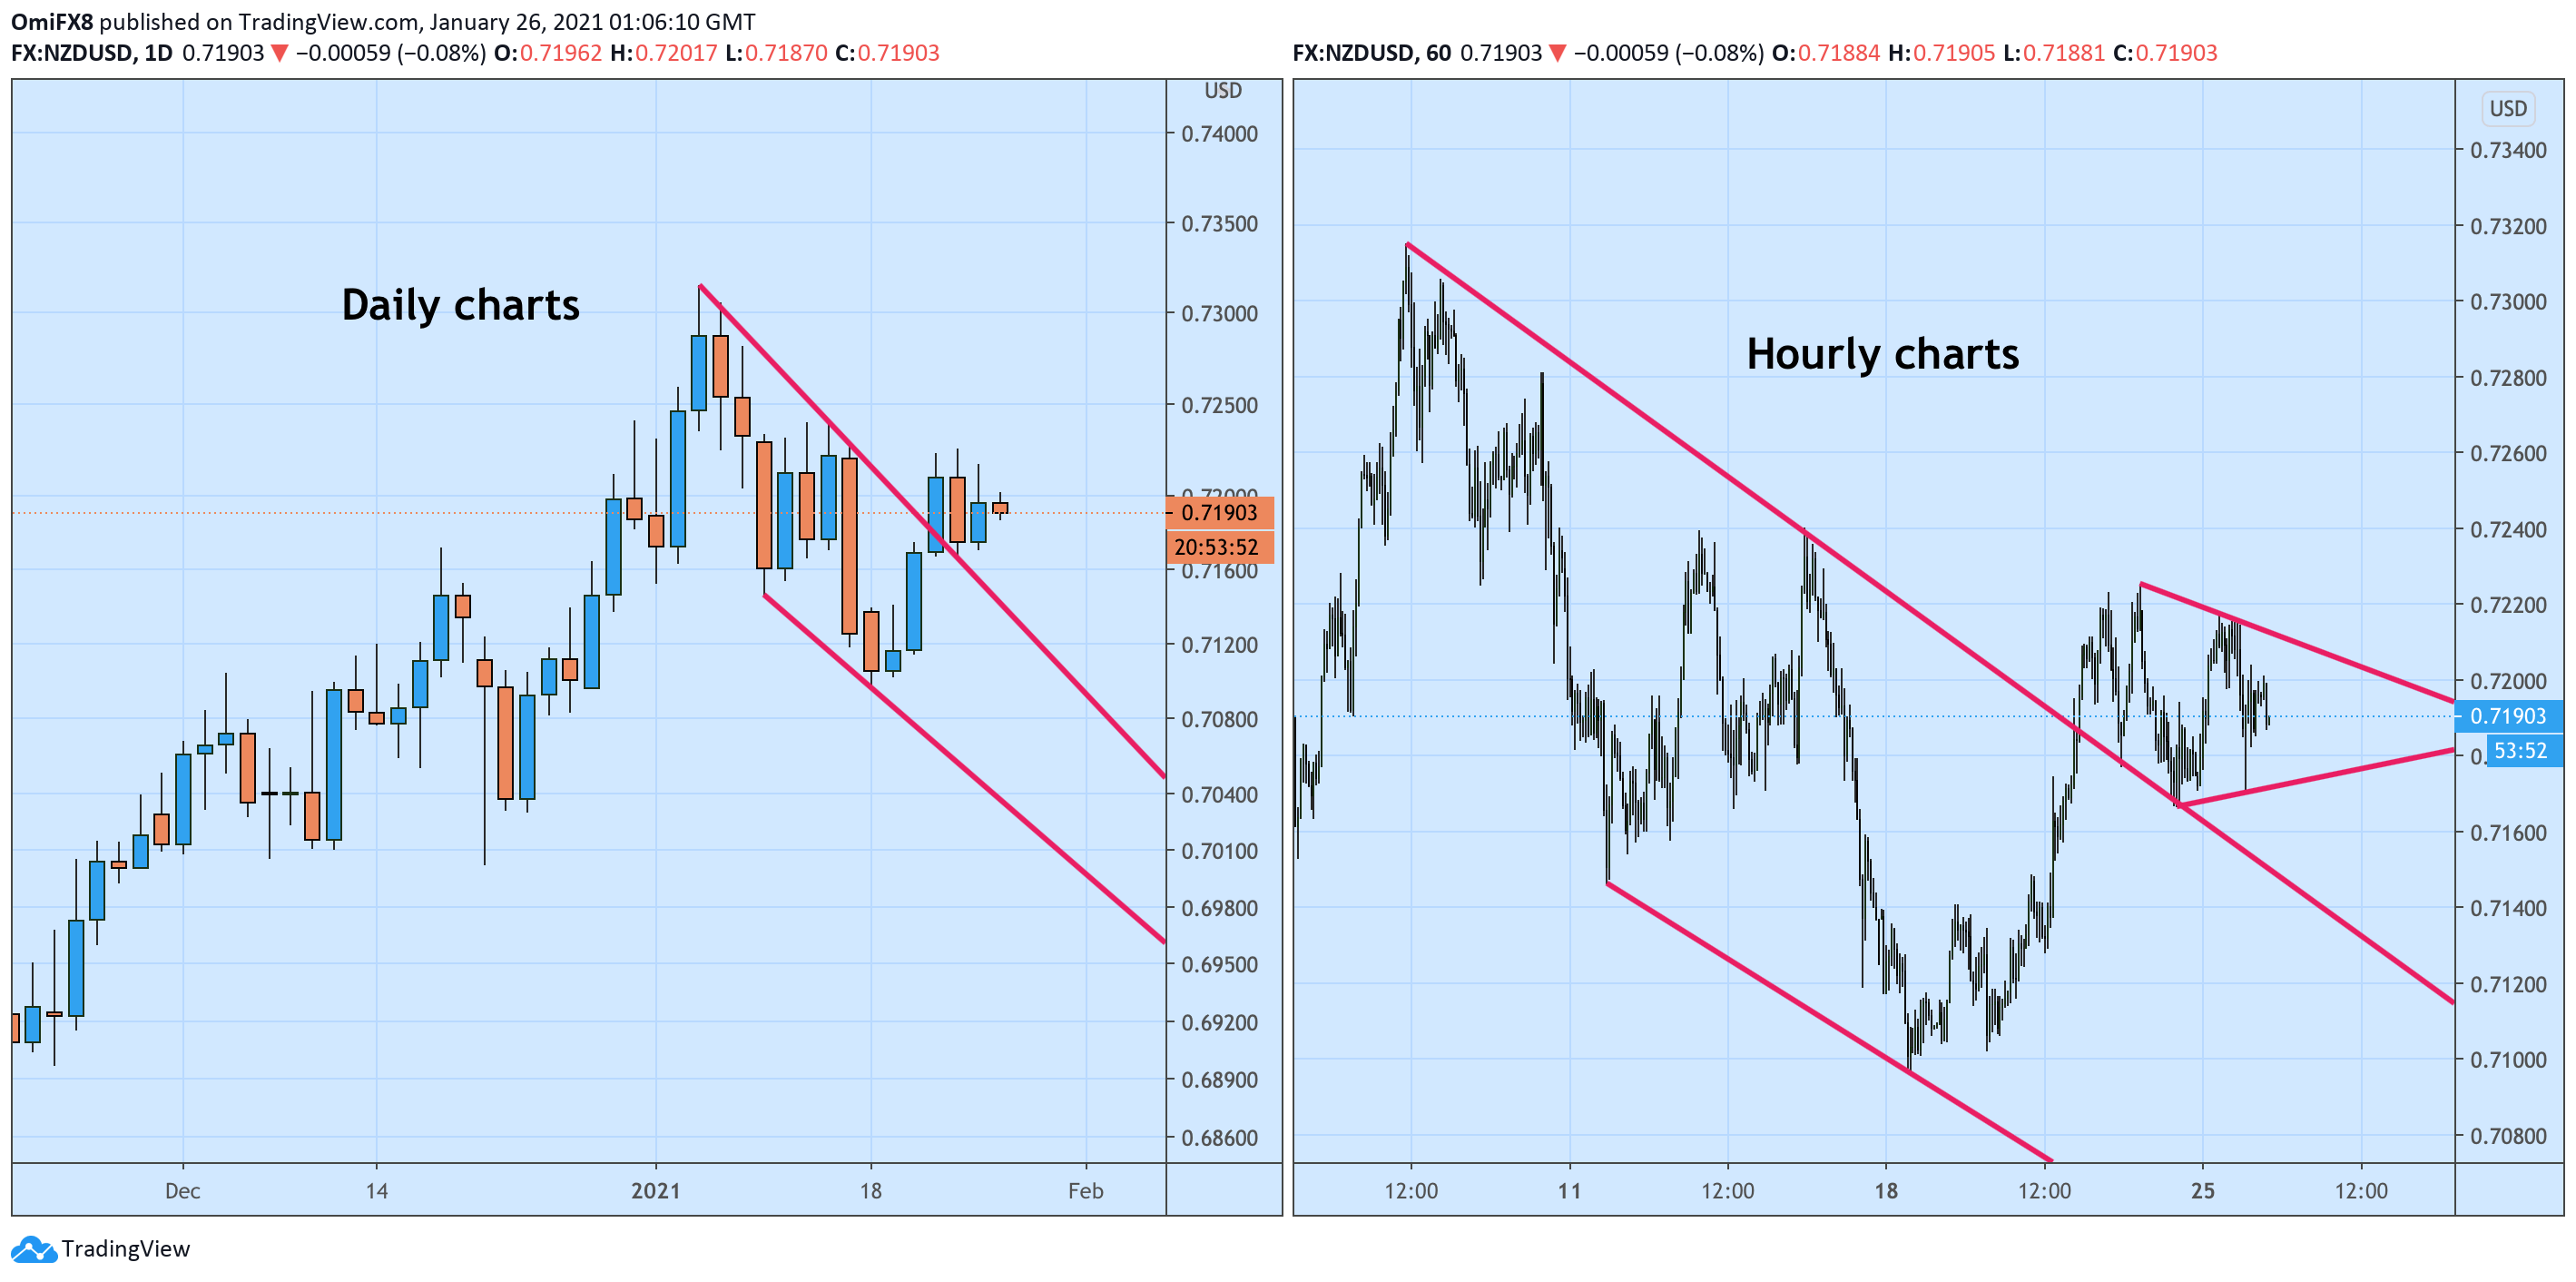
- NZD/USD's hourly chart shows a contracting triangle pattern.
- A breakout would validate the bullish pattern seen on the daily chart.
NZD/USD has created a narrowing price range over the past 48 hours or so, marking a weak follow-through to a bullish falling channel breakout confirmed by Thursday's 0.51% gain.
The immediate bias will remain neutral as long as the pair is trapped in the contracting triangle (narrowing price range) seen on the hourly chart. A move above the top end of the triangle, currently at 0.7212, would validate the daily chart falling channel breakout confirmed last week and open the doors for a re-test of the Jan. 6 high of 0.7315.
Alternatively, a range breakdown would shift risk in favor of a drop to the Jan. 18 low of 0.7096.
Daily and hourly charts

Trend: Neutral
Technical levels
