Gold Price Analysis: XAU/USD braces for $1,778 key hurdle on Fed day – Confluence Detector
Gold picks up bids to $1,737.30, up 0.33% intraday, ahead of Wednesday’s European session as geopolitical risk catalysts join the US dollar’s pre-Fed dull performance.
While Sino-American and US-Iran tussles are back in focus, challenges to the Federal Reserve Chairman Jerome Powell, in assuring traders of no tapering despite fiscal stimulus, seems to weigh on the US 10-year Treasury yield and offer extra strength to the yellow metal. However, the bond bears are still waiting for the Fed and may quickly retake controls as they’re not far from the recently refreshed yearly tops, which in turn probes gold buyers.
China may convey dislike for the US interference in Taiwan matters whereas North Korea has already warned the Biden administration over the wish of strong ties with South Korea. Iran is alleged to secretly build a nuclear arsenal and the UK stays firm to go beyond the deal to tame the ‘rogue’ behavior. Furthermore, American policymakers renew chatters over the Russian meddling into the US elections with fresh sanctions but karma played its role as Japan increased tariffs on the beef imports from Washington.
Although the US dollar’s failure to lure safe-haven bid ahead of the Fed keeps gold buyers hopeful, the yellow metal’s allure will soon be challenged if Powell and Company match market expectations.
Read: Federal Reserve Preview: The Good, the Bad and the Ugly edition, three critical things to watch
Gold: Key levels to watch
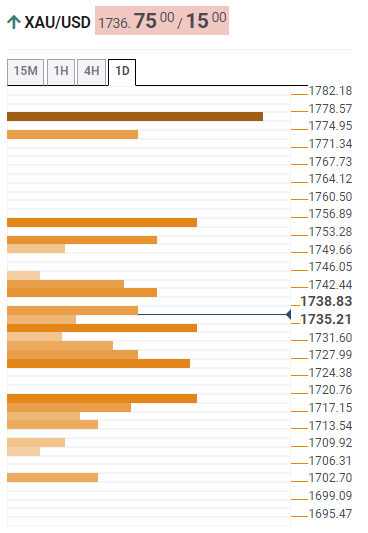
The Technical Confluences Indicator suggests the gradual upward trajectory for the gold prices towards the $1,778 resistance comprising SMA 200 on the four-hour (4H), comprising 23.6% Fibonacci retracement on one-month (1M) and Pivot Point’s second resistance, R2, on the weekly (W1) formation.
Ahead of that, a confluence of 23.6% Fibonacci retracement on 1M and Pivot Point’s first resistance, R1, on the daily formation (D1), around $1,755, can offer a strong hurdle to the north.
On a more immediate basis, the previous weekly high and 161.8% Fibonacci retracement on 1D, respectively near $1,742 and $1,750 in that order, can entertain the gold buyers.
Meanwhile, multiple short-term SMA on the 10-minutes and 15-minutes (15M) join the middle band of the Bollinger on the 1H and 15M, close to $1,730, to restrict the commodity’s pullback moves.
Following that, the previous 1D low and previous 1M low, respectively around $1,725 and $1,718, should test the bears before directing them to the $1,700 threshold.
It should, however, be noted that a clear downside break of the $1,700 round-figure will give green signals to the bears’ entry.
Here is how it looks on the tool
About Technical Confluences Detector
The TCD (Technical Confluences Detector) is a tool to locate and point out those price levels where there is a congestion of indicators, moving averages, Fibonacci levels, Pivot Points, etc. Knowing where these congestion points are located is very useful for the trader, and can be used as a basis for different strategies.