USD/CAS Price Analysis: Bulls and bears drawing their lines
- USD/CAD has something for both bulls and bears from a longer-term perspective.
- Bulls look to the M-formation while bears eye and downside extension.
USD/CAD is a compelling long-term chart that has something for both the bulls and bears. The following is an analysis of the weekly and monthly time frames that illustrate the potential for a bullish correction followed by a downside and significant bearish extension to the 1.1680s.
USD/CAD weekly chart: Failed bullish attempts
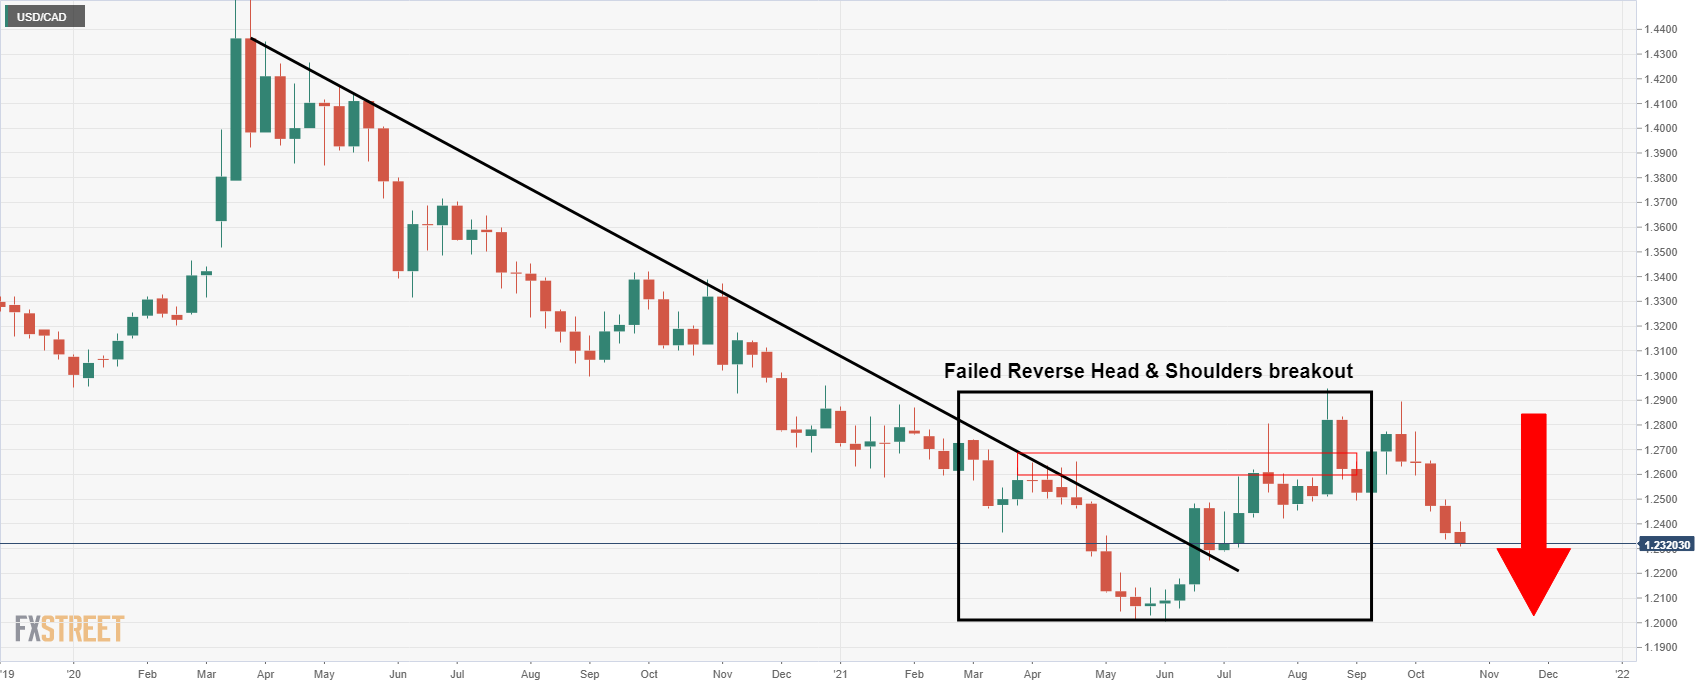
As illustrated, the bears tried to break out of the reverse head and shoulders in any significant reversal trend.
However, the Cup & Handle played out well, if only for a short while with the price breaking higher momentarily:
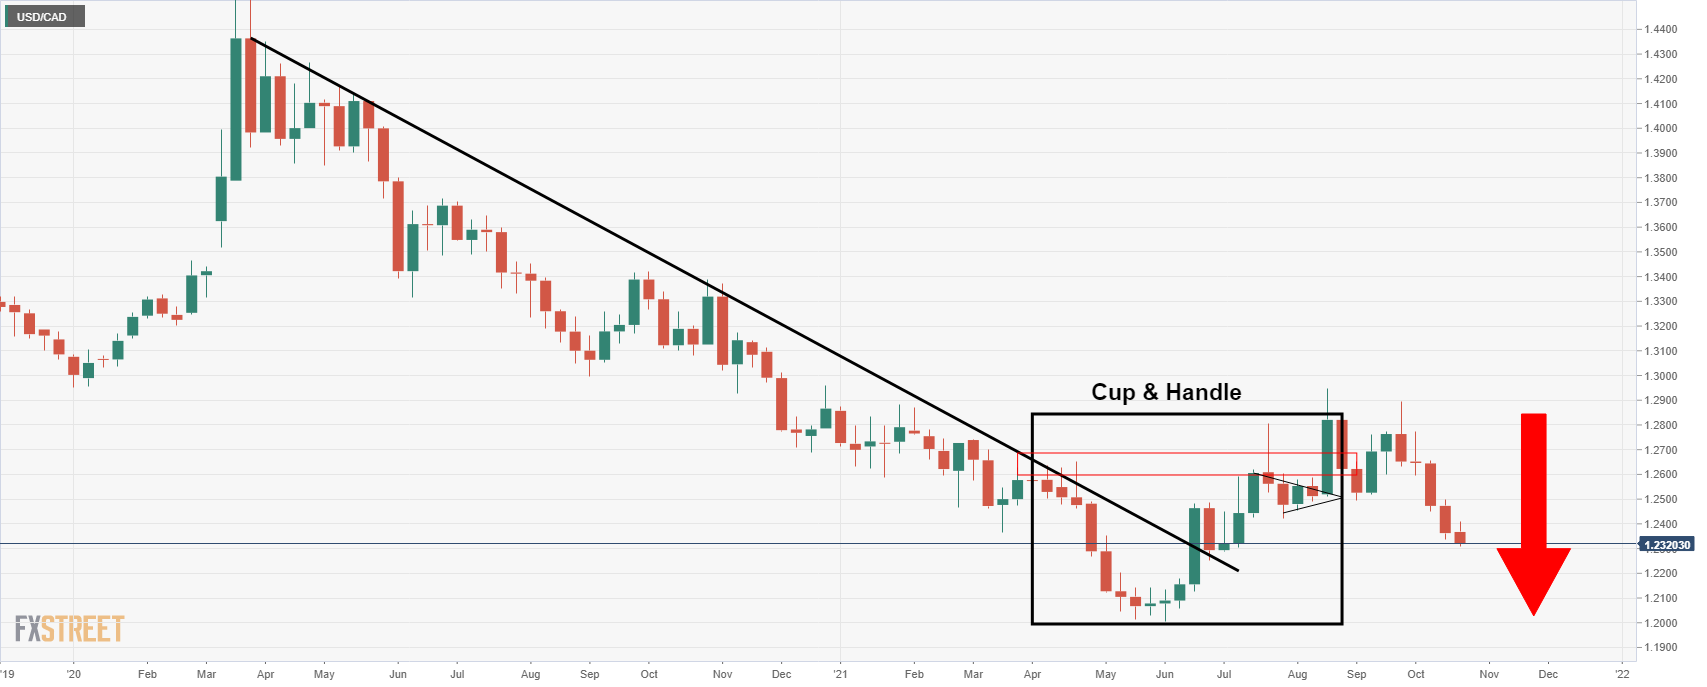
USD/CAD bullish and bearish playbooks
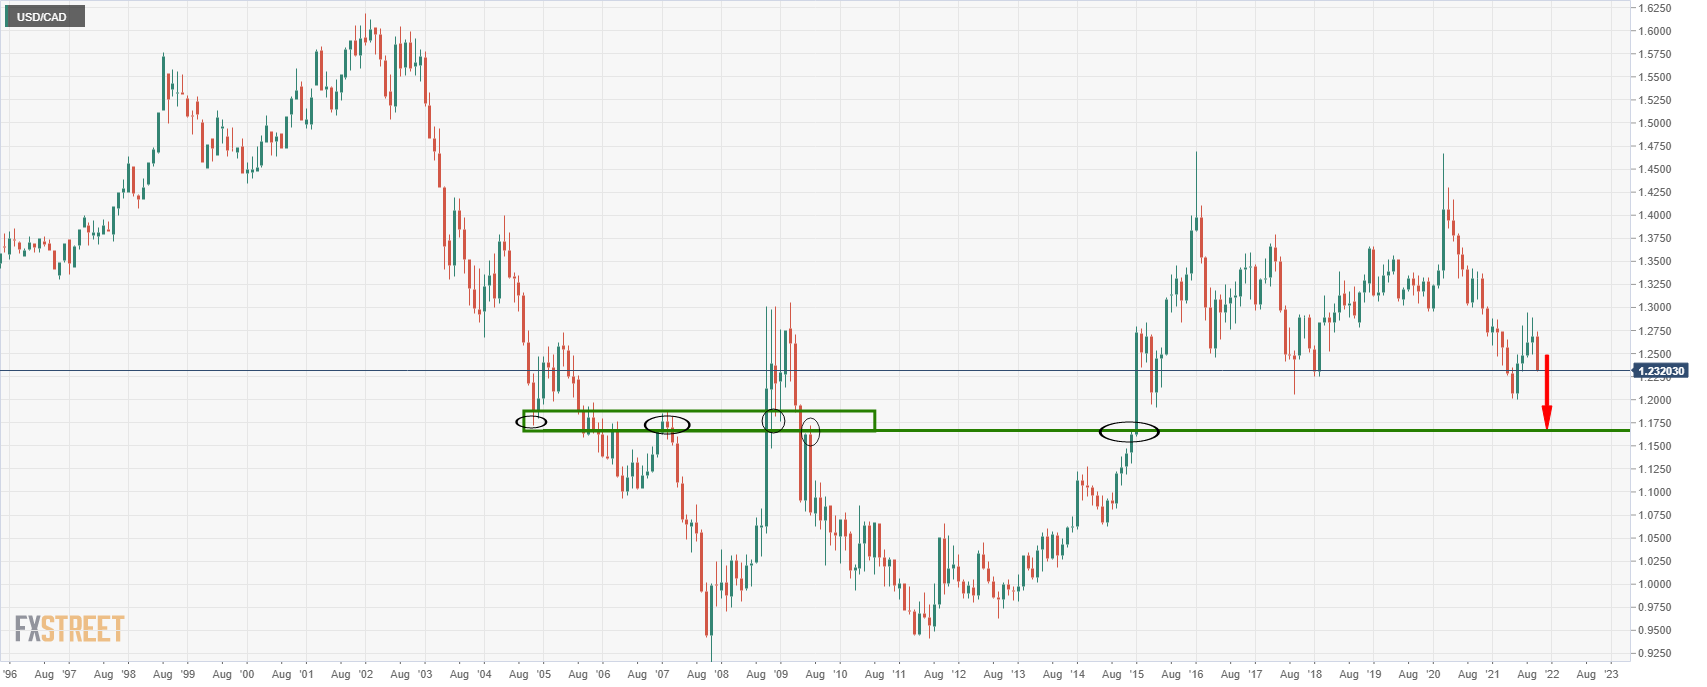
However, the price has now broken the trendline support as follows which would be expected to lead to a fresh weekly low in due course towards 1.1680:
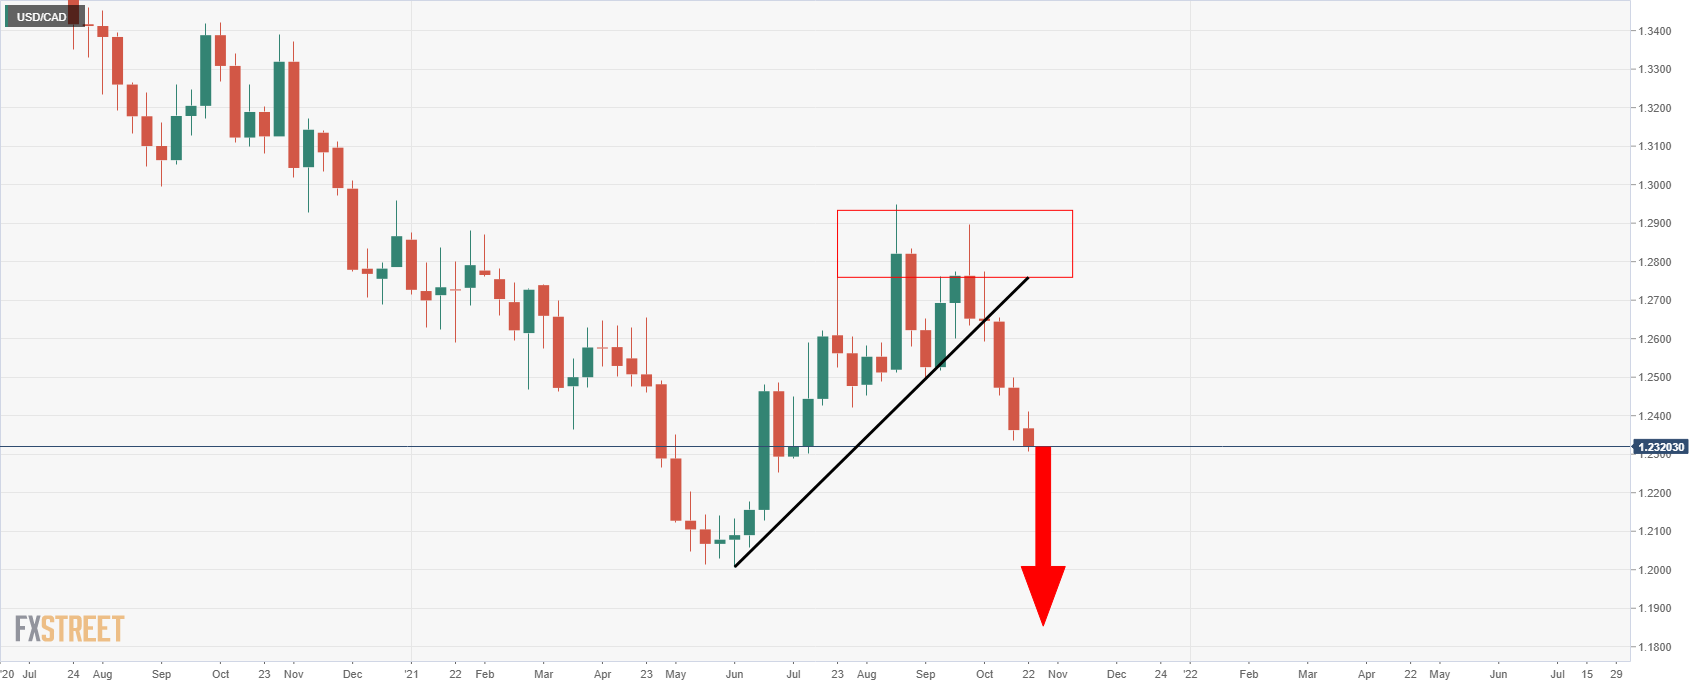
With that being said, however, there are prospects of a bullish correction to test the neckline of the M-formation, a bullish reversion pattern that has a high completion rate:
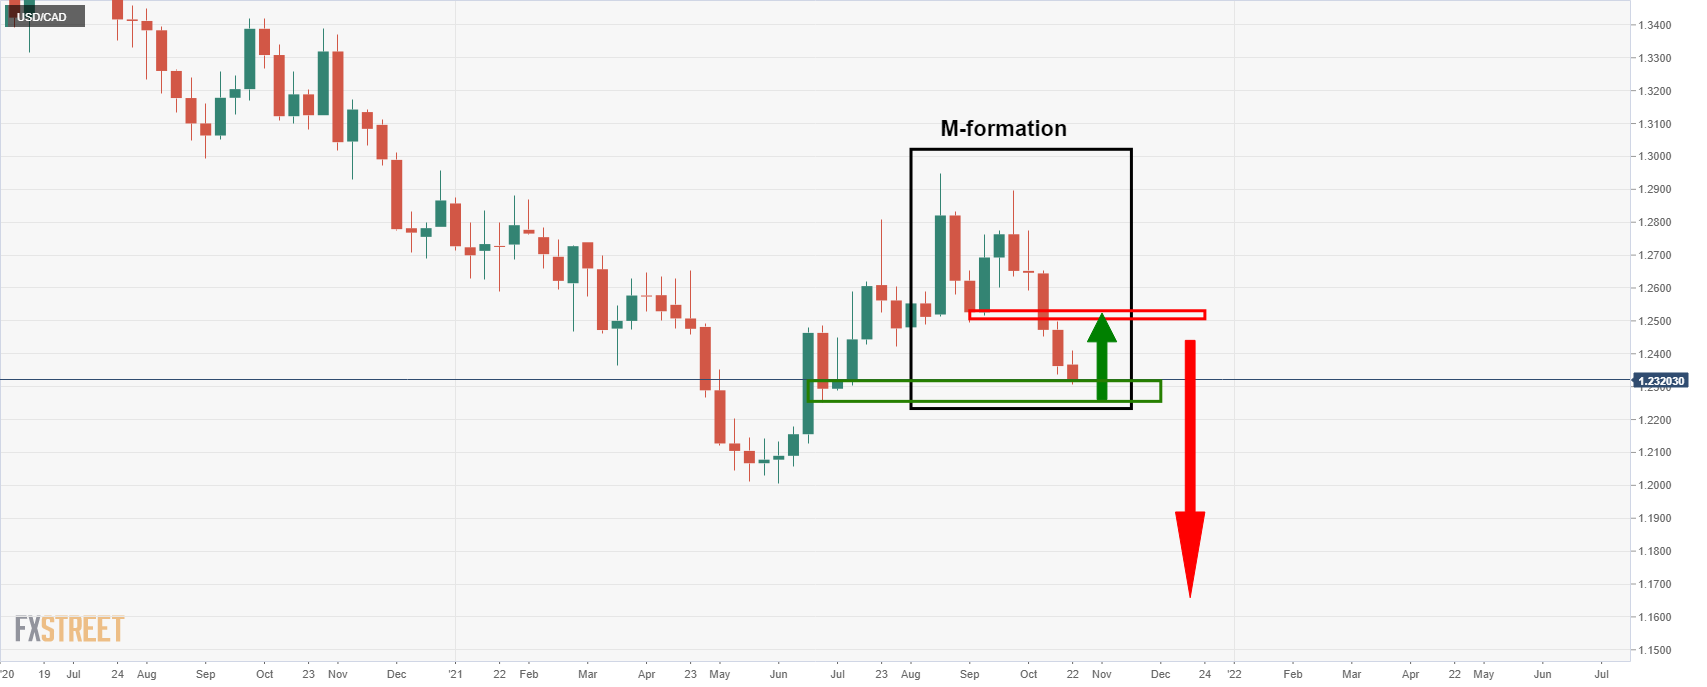
The price still has some room to go to the downside to fully test the demand area and it would be expected to take a number of days or even weeks before demand can outstrip supply. However, should the price indeed correct higher, it could be an attractive discount for the bears targeting lower lows and the 1.1680s. The 1.1680s is around where a -272% Fibonacci retracement of the current weekly correction meets a long term monthly structure level as follows: