Gold Price Forecast: $1,960 remains a tough nut to crack for XAUUSD bulls – Confluence Detector
- Gold Price remains vulnerable amid hawkish Fed, firmer USD and yields.
- Fed Chair Powell suggested aggressive tightening going forward.
- Friday’s closing is critical for XAUUSD’s bullish traders after the decline.
Gold Price remains weighed down by the narrative of an increasingly hawkish Fed, which got a boost after the central bank President Jerome Powell talked up front-loading rate hikes. The US dollar continues to follow its northward trajectory, piggy-backing the Treasury yields while no progress on the Russia-Ukraine crisis also offers support. Technically, XAUUSD needs a daily close above the SMA21 one-day to reverse the downtrend. Will that materialize?
Also read: Gold Price Forecast: Weekly close above 21-DMA is critical for XAUUSD buyers
Gold Price: Key levels to watch
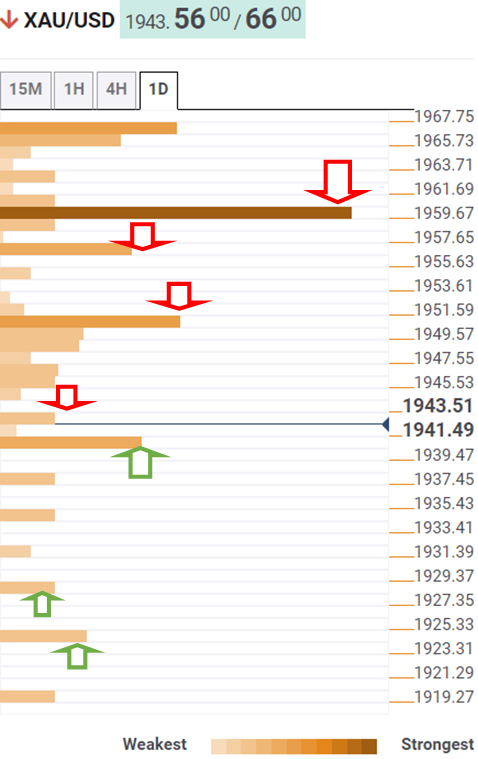
The Technical Confluences Detector shows that gold price is looking to attempt a minor recovery, as it challenges the Fibonacci 23.6% one-day at $1,943, at the moment.
If buyers manage to take over control, then Gold Price could recover further to test $1,950, a powerful confluence of the SMA200 four-hour and Fibonacci 61.8% one-day.
Acceptance above the latter will expose the Fibonacci 61.8% one-week level at $1,956. The last line of defense for XAUUSD sellers is envisioned at $1,960.
At that level, the previous year’s high, SMA10 one-day and Fibonacci 61.8% one-month coincide.
On the downside, the immediate support line is seen at the previous week’s low of $1,940, below which the SMA50 one-day at $1,935 will come into play.
Further down, the pivot point one-day S2 at $1,928 could get tested on selling resurgence. The next downside cap awaits at the pivot point one-week S2 at $1,924.
Here is how it looks on the tool
About Technical Confluences Detector
The TCD (Technical Confluences Detector) is a tool to locate and point out those price levels where there is a congestion of indicators, moving averages, Fibonacci levels, Pivot Points, etc. If you are a short-term trader, you will find entry points for counter-trend strategies and hunt a few points at a time. If you are a medium-to-long-term trader, this tool will allow you to know in advance the price levels where a medium-to-long-term trend may stop and rest, where to unwind positions, or where to increase your position size.