USD/JPY Price Analysis: Retraces from two-decade highs towards 134.00s
- USD/JPY dips towards 134.00 as buyers book profits ahead of Friday’s US CPI.
- Sentiment remains negative as US equities record losses.
- USD/JPY Price Forecast: The major is upward biased, but negative divergence in the weekly/daily chart might open the door for a pullback towards 131.00.
The USD/JPY retreats from 2-decade highs around 134.55 but is trimming substantial losses, and albeit losing 0.09%, is preparing for a test of the 135.00 figure. At the time of writing, the USD/JPY is trading at 134.20, a signal that traders are booking profits ahead of the release of US inflation data on Friday.
USD/JPY falls as bulls take profits
A dismal market mood keeps global equities pressured. In the FX space, the safe-haven currencies are rising. The USD/JPY is dropping, as above-mentioned by profit-taking and the closeness of the 135.00 mark, seen by some Japanese officials as a line of the sand to intervene in the FX markets.
In the meantime, the US Dollar remains bid, gaining 0.59% as portrayed by the US Dollar Index. The DXY is sitting at 103.151, underpinned by the US 10-year benchmark note rate parked around 3.033%.
Elsewhere, the USD/JPY topped around 134.50 and edged lower, breaking demand zones on its way south, like the daily pivot point at 133.74 and stopped shy of the S1 pivot point, at 133.01.
USD/JPY Price Forecast: Technical outlook
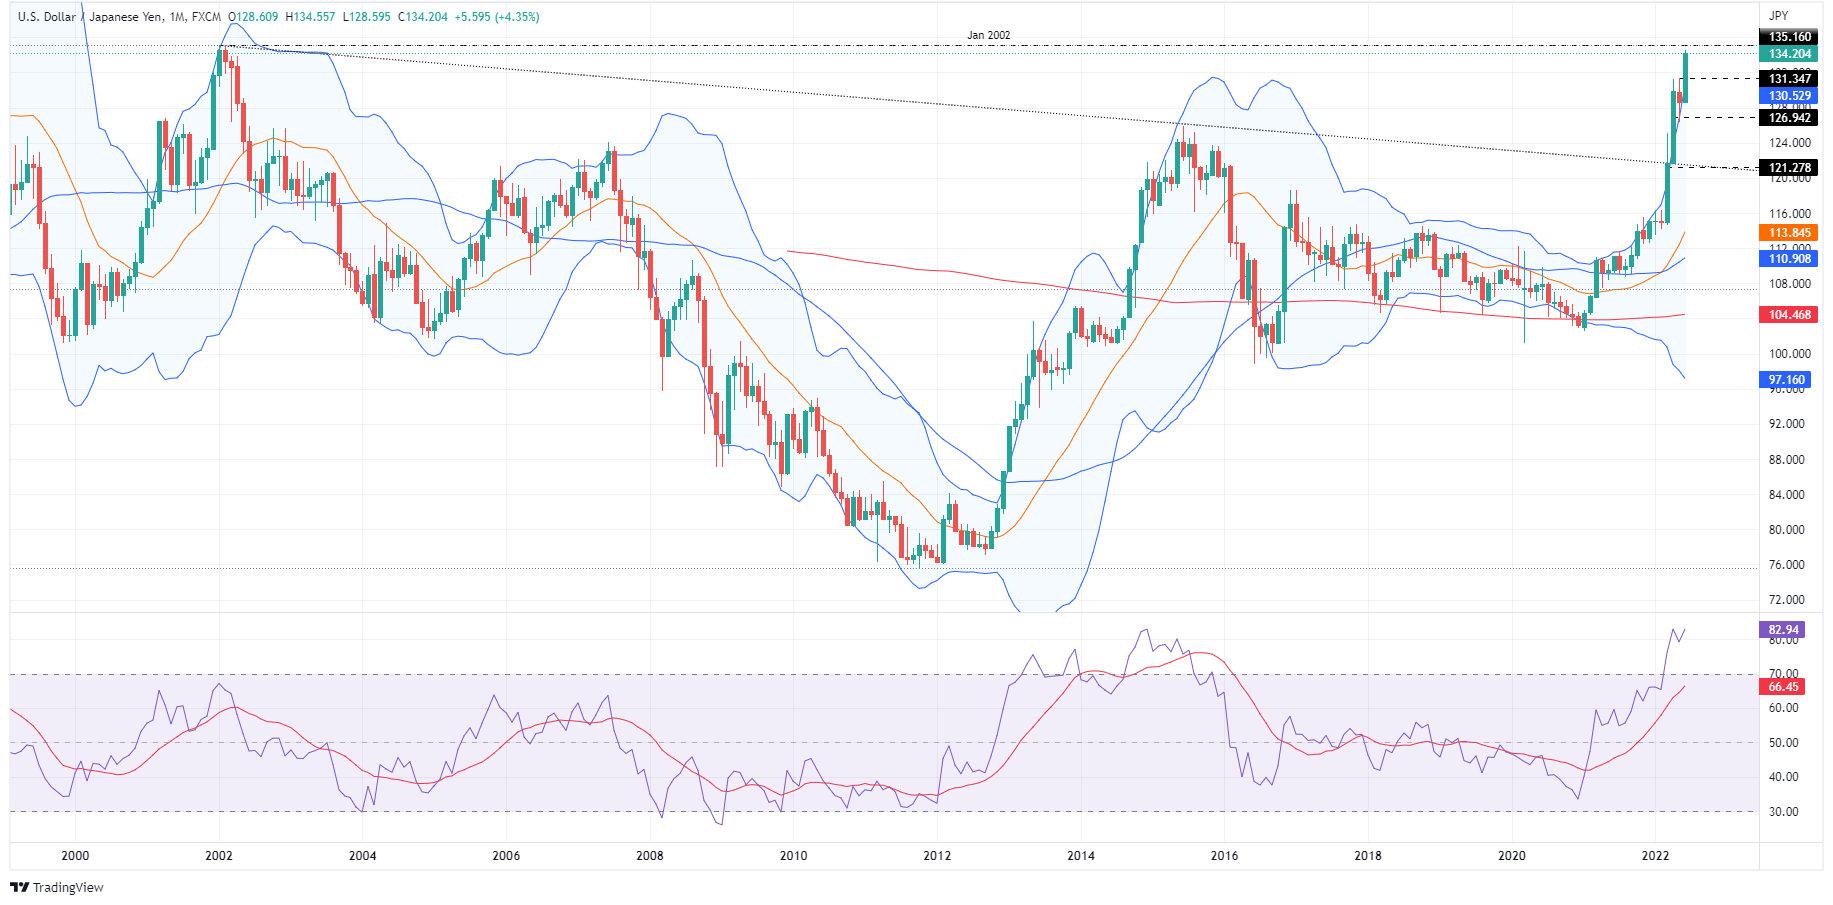
The USD/JPY monthly chart depicts the pair as upward biased, but RSI readings at 83 suggest the major might be about to peak soon. However, a rally towards 2002’s yearly high at 135.16 is on the cards. If the USD/JPY clears that hurdle, then a move towards the August 1998 high at 147.67 is on the cards.
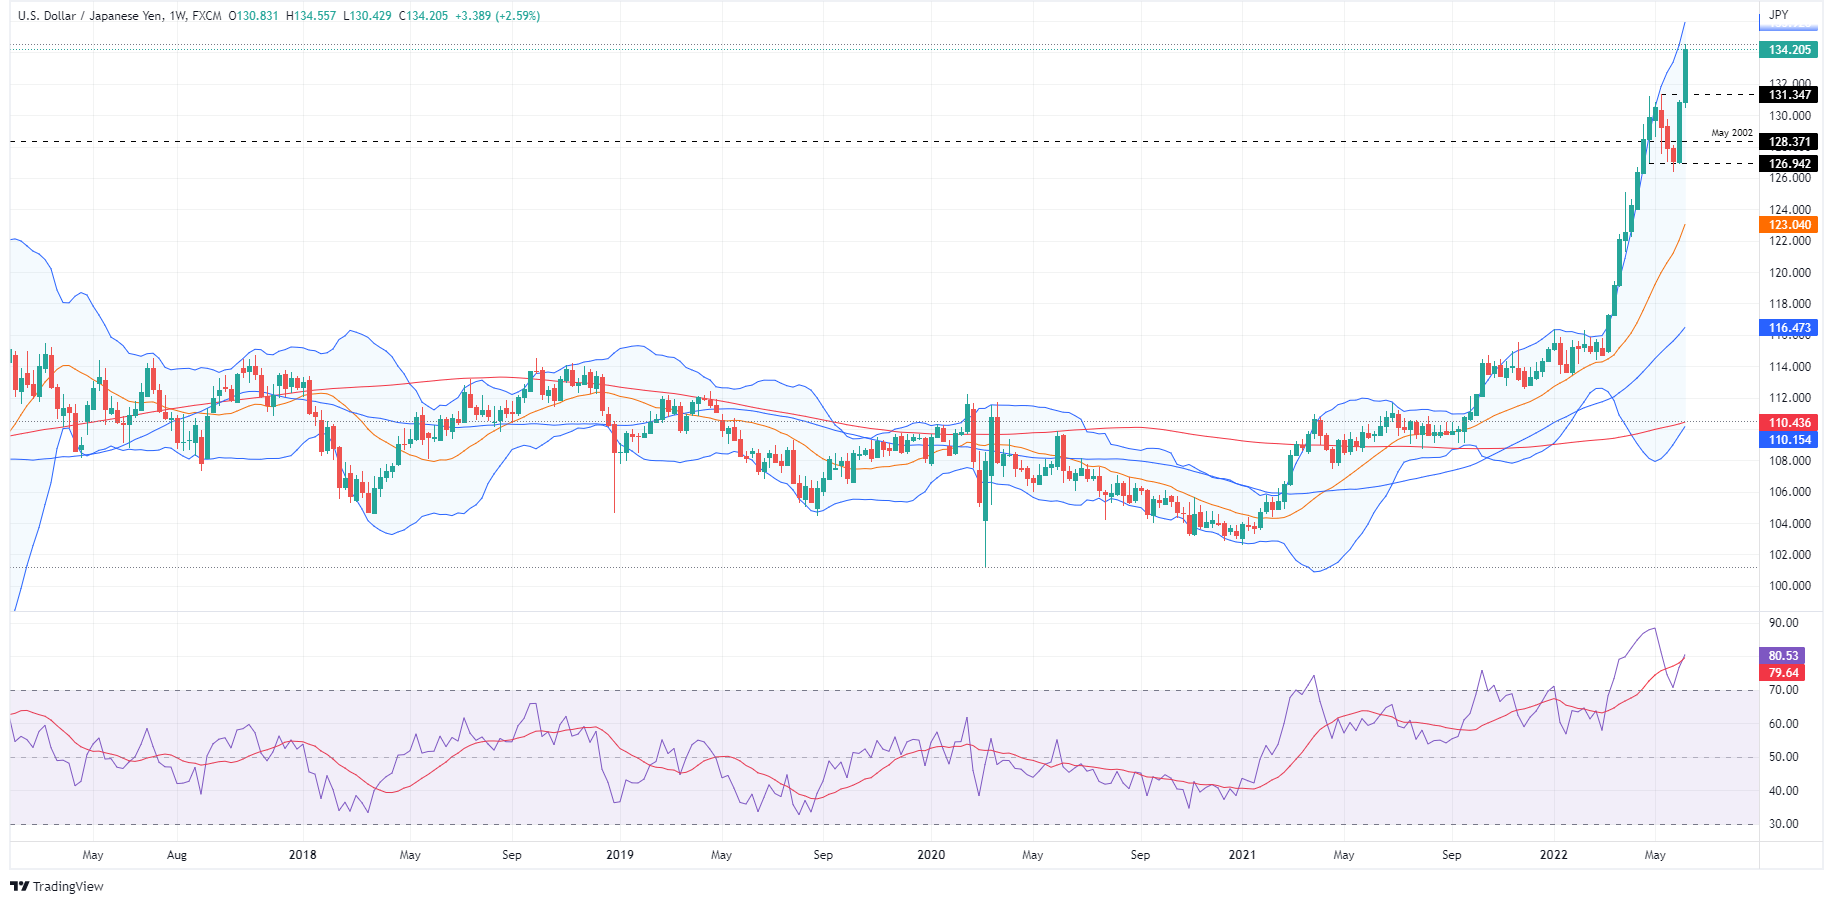
The USD/JPY weekly chart illustrates the formation of a negative divergence between price action and the Relative Strength Index (RSI). If that scenario plays out, the USD/JPY could fall towards 131.34.
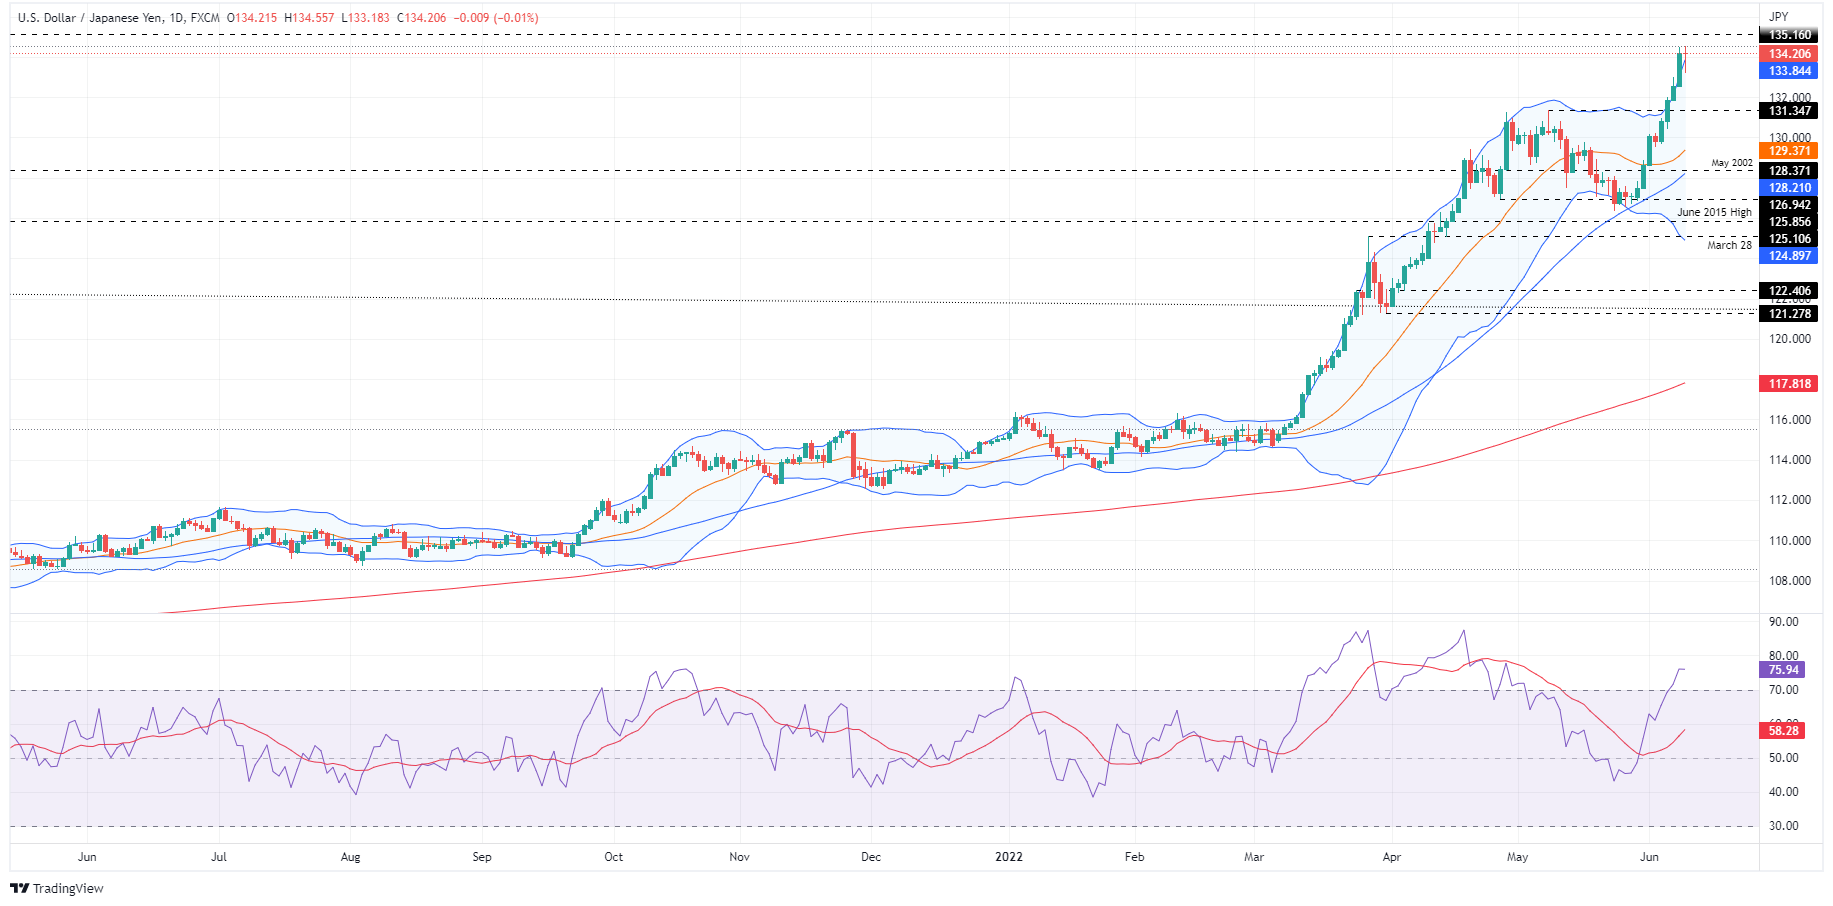
The USD/JPY daily chart portrays the pair as in a strong uptrend, recording gains of more than 700 pips in the last ten trading days. Nevertheless, the USD/JPY lost 0.19% in one of those ten days and at the time of writing, is down by 0.04%. Also, a negative divergence between price action and the RSI formed and might open the door for a pullback.
That said, the USD/JPY’s first support would be the June 7 low at 132.54. A breach of the latter would expose the June 6 low at 131.84, followed by the May 9 swing high-turned-support at 131.34.